
The Lamacchia Housing Report presents overall home sale statistics and highlights the average sale prices for single families, condominiums, and multi-family homes in Massachusetts and Southern New Hampshire for October 2018 compared to October 2017. It also looks at other metrics in Massachusetts like Homes Listed For Sale, Homes Pending, and Price Adjustments made to active listings, as they are often the best indicators for predicting future trends in the market.
Massachusetts October Home Sales Down 1.07%
Massachusetts home sales decreased by a negligible amount in October, by just over one percent. Last October, there were 8,051 sales in Massachusetts which dropped to 7,966 in 2018. Multi-families increased by 16.18% from October 2017 to October 2018, with 869 sold this year compared to 748 in 2017. Single families and condos decreased by .98% and 7.51% respectively which brought the overall sales down for October. Single family sales decreased to 5,176 from 5,227, and condo sales fell to 1,920 from 2,076.
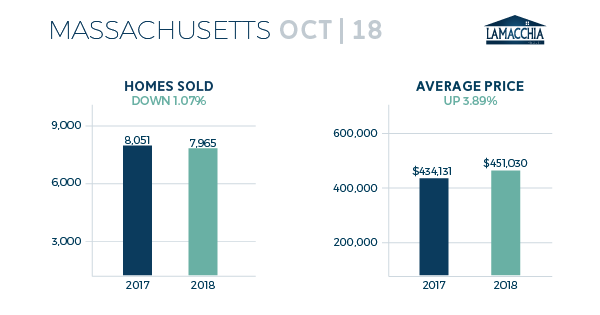
Prices have continued to rise in spite of the decrease in home sales. Compared to last October 2017, prices increased by almost 4% going from $434,131 to $451,030. Multi-families and single-families increased in sales prices but condos decreased by 2.70% ($357,713 falling to $348,052 in October 2018). Multis increased by 6.12% going from $462,381 to $490,701 and singles increased by 5.66% now at $499,297 from $472,555.
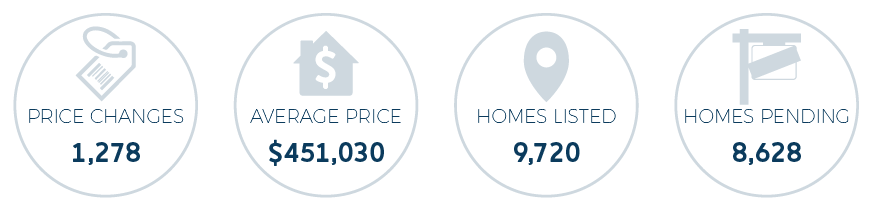
In Massachusetts, there were 1,278 homes for sale that made price adjustments, up by 26.28% over last October when there were 1,012. As Anthony sited in his Opinion Editorial in September price adjustments began to increase just as inventory did back in early August when the market began to slow down.
Homes Listed for Sale:
In October 2017, 8,672 homes were listed for sale in Massachusetts compared to 9,720 in 2018, showing a 12.08% increase. An increase in homes listed could be a sign of an increase in activity for November’s report. Regardless, it proves that colder weather doesn’t necessarily slow the market down, as explained in our recent Mythbuster blog. With inventory still active in October, November could show an increase in pending home sales, and we will see when that report comes out next month.
Pending Home Sales:
There were 8,729 homes that went pending in October 2017 and 8,628 in October 2018, showing a 1.16% decrease. A slight decrease in pending home sales could point to a decrease in home sales next month, but not for sure. Buyers are still active during the holiday season as it’s still a great time to buy with inventory being higher than the late summer months. As well, as inventory naturally diminishes in the first few months of the new year, now is the time for buyers to secure that home they want before competition strikes again.
Southern New Hampshire September Home Sales Down 1.44%
The number of properties sold in Southern New Hampshire decreased by 18.63% from 1,358 to 1,105, with decreases in all three categories. Multis decreased by the largest percentage, down 35.82% going from 67 sales to 43. Single family and condo decreases were neck and neck with decreases of 17.81% and 17.55% respectively. Singles are down to 766 from 932 sales in October 2017, and condos are down to 296 from 359 sales.
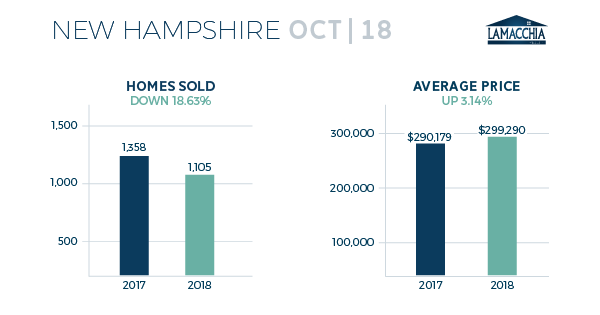
The average price for homes in New Hampshire increased, however, by 3.14%. Multis were the only category that had a decrease of price year over year, with $354,387 dropping by 10.54% to $317,029. Single-family prices increased by just under 2% from $308,655 to $314,042 in 2018. Prices for condos increased by 16.05% from $224,181 in October 2017 to $260,163 in 2018.
What’s Ahead?
The number of homes listed in October is up by almost 20%, so it pushed the inventory of homes for sale that was already higher than a year ago to even higher than the fall of 2016.
The number of price adjustments increased again this month which is a sign that sellers have woken up and realized they are not in as dominant of a position as they were back in the spring. The buyers who bought homes this fall will be happy they did since its been the best fall to buy since 2014. With fewer buyers out there and with more motivated sellers- demand down and supply up- it’s natural that homes take a bit more time to sell but it doesn’t mean the house has issues as explained in this blog. Interest rates are staying in the high fours and low fives, making it a bit more expensive for buyers to borrow money, which is another reason price adjustments are key in getting homes sold. That lower list price will make a seller’s home more likely to be affordable to their perfect buyer. Now that we are heading into winter, sellers should start to prepare their home for sale and better attract buyers after the New Year.
Anthony broke down all the details about why the market has changed, how it happens and what he expects in the months to come in this real estate market update video before Thanksgiving.