

The Lamacchia Housing Report presents overall home sale statistics and highlights the average sale prices for single families, condominiums, and multi-family homes in Massachusetts and Southern New Hampshire for August 2018 compared to August 2017. It also looks at other metrics in Massachusetts like Homes Listed For Sale and Homes Pending, as they are often the best indicators for predicting future trends in the market.
Massachusetts August Home Sales Up 1.40%
Only a slight increase in Massachusetts as home sales increased in August 2018 over August 2017 by 1.40% in all three categories. Multi-families increased by the largest percentage, at 12.95% over last year with 968 this year compared to 857 last. Single families increased in sales by 0.84% from August 2017. 6,759 were sold in August 2017, compared to 6,816 this year. Condos decreased by 0.91% with 2,644 last August falling to 2,620 in 2018.
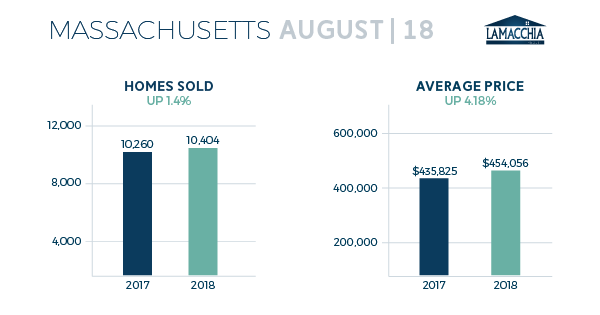
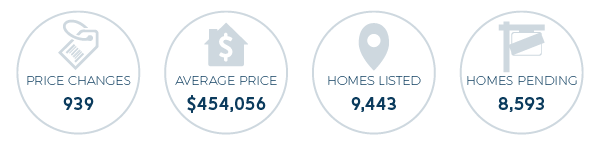
Overall, prices increased by 4.18%, from $435,852 in August 2017 to $454,056. Single-family prices increased by 5.76% which was the largest change, with $503,997 as the average in 2018 compared to $476,546 in 2017. Condos increased this past month by 4.99% rising from $348,832 to $366,224. Multi-families increased by a little over half a percent, coming in at $474,668 from $471,983. In the month of August, there were 939 price changes, when sellers reduced their list price, up 6.46% from July when there were 882. An increase in price changes is to be expected with the increased inventory of homes for sale and with fewer buyers out there consuming listings as soon as they become available. Typical fall market behavior.
Homes Listed for Sale:
In August 2017 9,126 homes were listed for sale in Massachusetts compared to 9,443 in 2018, showing a 3.47% increase. Not a giant increase year over year, but it does still show that buyers are having an easier time finding homes because more are available.
Pending Home Sales:
There were 8,902 homes that went pending in August 2017 and 8,593 in August 2018 showing a 3.47% decrease. Pending home sales being down slightly year over year could be a result of the delayed fall upswing in inventory as it remained lower much longer this year and the buyer’s market didn’t kick into gear until a bit later than usual.
Southern New Hampshire August Home Sales Down 9.65%
The number of properties sold in Southern New Hampshire decreased by 9.65% from 1,565 to 1,414, with decreases in two out of three categories. Multi-families was the only category that increased, by 11.48%, moving from 61 sold in 2017 to 68 sold this August. Condos decreased by 12.72% with sales moving from 393 in August 2017 to 343 this year. Single families saw a decrease of 9.72% bringing sales to 1,003 this year compared to 1,111 last year.
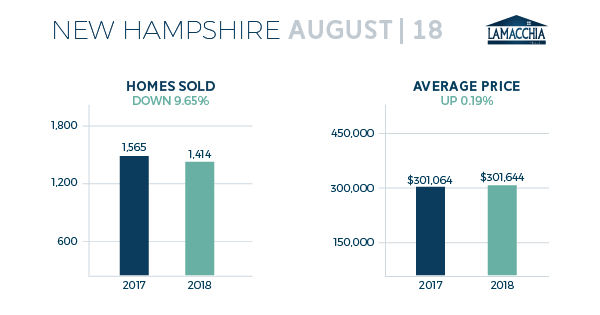
The average price for homes in New Hampshire increased by a mere 0.19%. Condos were the only category that had an increase of price year over year, with $235,180 increasing by 3.42% to $243,227. Single-family prices decreased by 0.32%, from $335,035 to $333,973 in 2018. Prices for multi-families decreased by 3.83% from $309,007 in August 2017 to $297,172 in 2018.
What’s Ahead?
Anthony recently published an op-ed explaining why the real estate market has changed; the inventory is higher this year than it was last year, price adjustments are up, and interest rates are rising. The market change is not the same thing as the seasonal shifts we expect four times a year, this time the factors are outside of the circumstantial effects of fall and the start of school, families sitting tight until spring, buyers taking advantage of the fall inventory, and sellers willing to accept reasonable offers. This year, inventory isn’t being eaten up as quickly because buyers are concerned that something is wrong with a home that has been on the market for longer than a week (hint: it’s fine). Sellers heard that their neighbor sold for a large amount of money in the spring, so they’re expecting the same return when listing in the fall- which isn’t possible. Spring’s lower inventory generally incites bidding wars and over asking offers, and fall’s higher inventory means that sellers need to price aggressively or will likely have to undergo a price change to attract more buyers. With inventory being even higher this year than last- this circumstance is magnified, and we see that with the increase in price changes this month. Now, with interest rates being higher than they’ve been in months and increasing at a pace that they may break the 7-year ceiling- borrowing is becoming more expensive for buyers. This could be responsible for slowing the pendings down in the coming months as buyers will have to reevaluate what they can afford.
It’s not all bad news though! These factors are showing that the economy is strong- spring will be busy once again and lucrative for sellers- and now still truly is the best time of the year for buyers to get the homes they want!