
Every winter we talk about how listing in the winter makes you the most money. This year is no different since we are at the point where the inventory is at its lowest and the buyers are out in force especially due to the mild winter.
The only difference is that for the first time in six years inventory right now is higher than it was last year at this time. We continuously monitor inventory on a state-wide base every week. Every blog or report we have put out at this time of year has covered how inventory was lower than the year before at this time and that pattern has finally snapped! Last August, we saw signs that this pattern would change and now it’s officially happening.
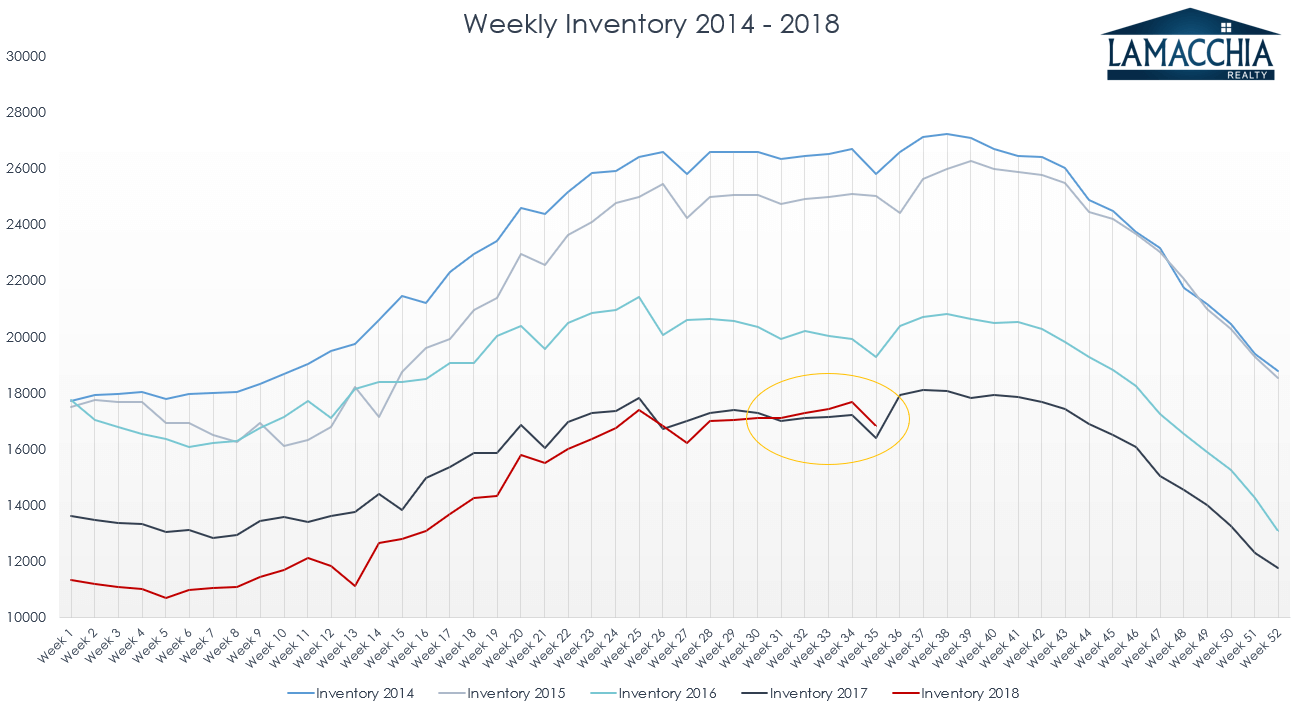
As you can see in the graphic above, August of 2018 depicted inventory crossing up and over the previous year’s inventory level. Weeks later, Anthony predicted that inventory was going to continue to rise and that we would see the end of the steady decrease we saw over the last six years and here we are with the evidence.
Inventory, including single families, multi-families, and condos for all of Massachusetts, was up to 12,948 homes for sale on February 10th, 2019 compared to the same date a year ago when there were 10,970 homes for sale according to MLS’s on market snapshot report. This shows that state-wide inventory 18% from this time last year!
By Area:
Now to the interesting part….in many areas closer to Boston its up dramatically more than 19%. We decided to look at specific areas across the state to get a better local sense. To show the trends in inventory across the state of Massachusetts, we studied each of our five Lamacchia Realty office towns and three surrounding towns because they are relatively spread out geographically. See the report below.
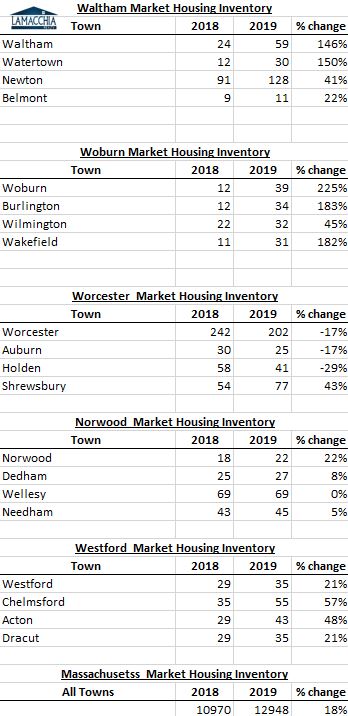
In Waltham, you can see overall the number of homes on the market has increased from 2018 to 2019. Waltham increased by a surprising 146%, Watertown by 150%, Newton by 41% and Belmont by 22%.
In Woburn inventory on the market has increased even more than Waltham, up by 225% from 2018 to 2019. Surrounding towns, Burlington, Wilmington, and Wakefield, have also since increased substantially from 2017 into 2018.
Conversely, the Worcester market saw a decrease in inventory from 2018 to 2019. This is extremely interesting and very telling as to what seems to be happening. It seems that buyers are getting pushed away from Boston due to the prices and are buying in Worcester county due to it being far more affordable. Anthony was recently quoted in an article on this exact topic in the Worcester Telegram and Gazette.
In Norwood, the market inventory has increased by 22%. There has been a small increase in Dedham and Needham, 8% and 5% respectively. Wellesley, however, showed no change from this time last year.
The Westford market inventory increased 21% from this time last year. Chelmsford increased by 57%, Acton increased by 48% and Dracut increased by 21%.
What does this mean for sellers?
Home sellers need to be particularly aware of this because they will need to price their homes accordingly. Home sellers in most of these areas (all but Worcester) will not have as much of an upper hand as they have had in recent years.
Pricing a home based on what a neighbor sold for last spring may not get your home sold. Homes that sell fast sell for the most money, so it’s a better strategy to price aggressively and potentially drive enough interest from multiple buyers to elicit multiple offers.
Sellers need to be very careful not to overprice really in any market but now especially for those in four of these five areas. This isn’t to say that you couldn’t still overprice in the Worcester area as you certainly could but with inventory being much lower than a year ago you do have more room to push it. Overpricing will only detract from buyer engagement and cause the home to sit long enough that even interested buyers are going to incorrectly assume there’s something wrong with the home, even if they only wrong element is the list price.
Your Realtor should expertly know how to analyze proper data based on the current market and the property to devise the best list price.
What does this mean for buyers?
Buyers rejoice….in most areas other than Worcester! For the past 6 years, we have had to find ways for buyers to get the homes they want with low inventory working against them and driving prices up. According to our 2018 Year in Review, Massachusetts prices increased, and sales decreased because of that market climate.
The supply was low and demand was up which made it a feeding frenzy for people looking to purchase a home. Furthermore, sellers who wanted to sell became trigger shy because they felt that their current home would sell too fast for them to purchase a home to move into. This was the Worried Seller phenomenon we addressed in March of last year. Sellers pulling back and not listing just fed into this lack of inventory making it even more difficult for buyers to have choices or any negotiating power in the market. Beggars, after all, cannot be choosers.
Though it may not be a dramatic increase state-wide, certain towns may see inventory increases steadily this year giving buyers the upper hand once again.